Clean Energy Analytics
Dashboard Design
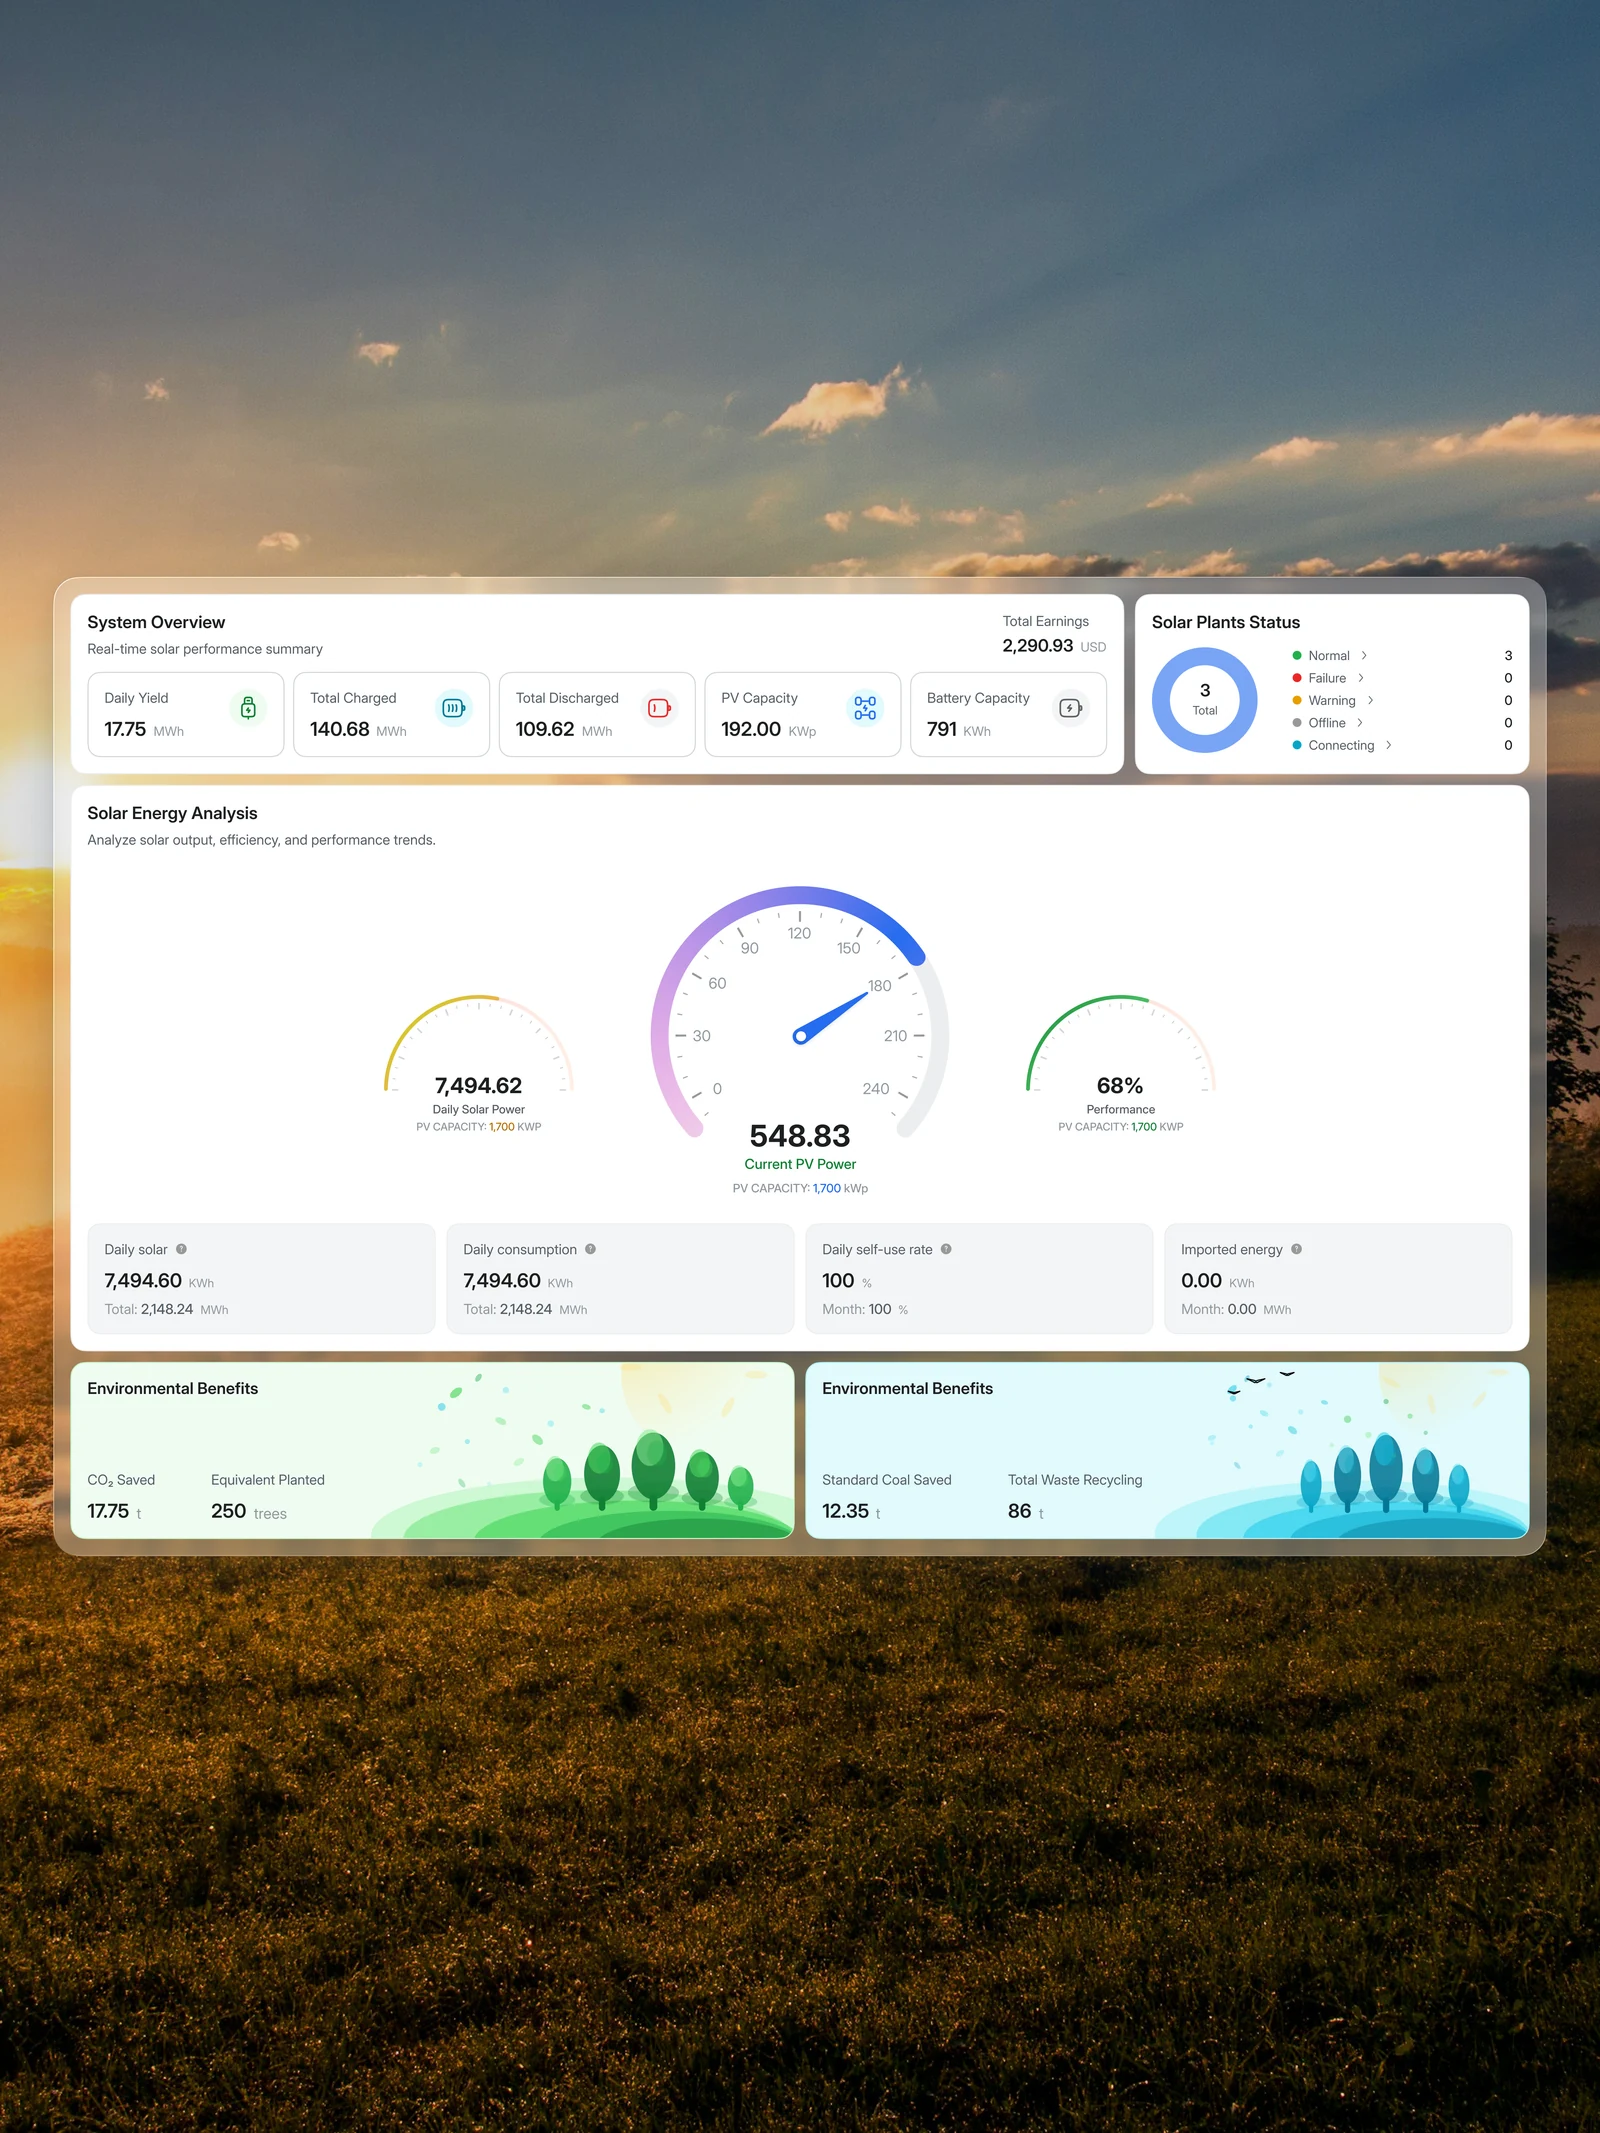
(2026)Energy data is loud - kilowatts, sources, costs, thousands of readings a day. But the first question is always simple: are we making more than we’re using?
So I built the whole dashboard around two numbers - Production and Consumption - and let everything else answer what comes next. Frosted white panels, calm blues and greens, charts that breathe, nothing louder than it needs to be.
Case study coming soon